
Uttarakhand Rural Development and Migration report-cm!
CM Rawat releases Uttarakhand Rural Development and Migration Commission recommendation report for District Pauri
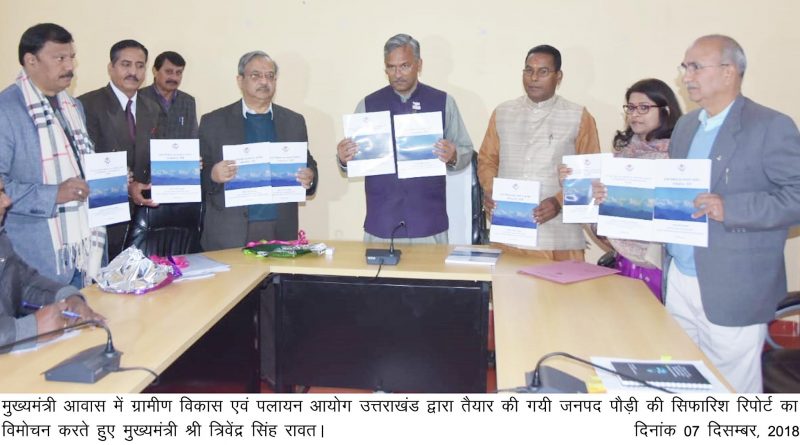
Chief Minister Mr. Trivendra Singh Rawat released the Uttarakhand Rural Development and Migration Commission’s recommendation report for the District Pauri at CM residence on Friday. Chief Minister said that what has to be done to stop the migration and ensure development in the district is analyzed in the recommendation report. After Pauri – the most affected district with migration, Almora and other districts will be studied. At the same time, the state government will work on the action plan for development in the affected districts with joint efforts of all departments related to rural development. He said that the Cooperative Department has planned Rs 3600 crores project for rural development, which has been recommended by the Union government as well. It is a loan based system in which 80 per cent was to be borne by state and 20 per cent by the central government. Now it has been changed to 60-40 ratio. State government will soon launch a major action plan for the implementation of various schemes for rural development.
This recommendation report of the Uttarakhand Rural Development and Migration Commission is available on the Commission website.
On this occasion, Principal Secretary Manisha Pawar, Vice President of Rural Development and Migration Commission Dr. SS Negi and other senior officials were present.
Dr SS Negi informed that a report has been submitted on recommendations for strengthening socio-economic development in rural areas by the Rural Development and Migration Commission, Pauri Garhwal. In the report, there are recommendations for strengthening socio-economic development in rural areas of Pauri Garhwal district for mitigating out migration.
The 2011 census reports a population of 6,86,527 of which nearly 83.59 per cent of the population resides in rural areas, whereas the rest 16.41 per cent is the urban population. There has been a declining trend in population over the past four census and a negative population growth rate of -1.51 has been reported in 2011 census.
There has been a declining trend in population of Pauri Garhwal over the past four census. The population growth rate of -1.51 has been reported in 2011 census. As per the table 2.1 the decadal growth of population (2001-2011) in urban areas in the district has increased by 25.40 per cent and the rural population has significantly declined by -5.37 per cent.
From 15 development blocks, there is negative growth rate in the last decade (census 2011) in 12 development blocks. During the Financial Year 2016-17, at constant price, the growth rate of the state was 6.95 per cent and 6.96 per cent for the district Pauri Garhwal. The GDP of state was Rs. 1,95,606 crore and for District Pauri Garhwal it was Rs. 8,283.56 crore, at current price for Financial Year 2016-17. The district’s GDP contributes nearly 4.23 per cent to the state’s GDP. District Pauri stands at number five, after Haridwar, Dehradun, Udham Singh Nagar and Nainital in contribution to state’s GDP. Even though the district accounts for 10.17 per cent of the total geographical area of the state and is the fifth most populated district, it accounts for only 4.23 per cent of the states GDP. Further, the MPCE (Monthly Per Capita Consumer Expenditure) for Pauri (Rural) is Rs. 1294.87 and for Pauri (Urban) is Rs. 2145.62, which is lower than the state and national average. As per the Industrial Profile of District Pauri Garhwal, Ministry of MSME there are a total of 6,272 numbers of registered units in Pauri as of 2016, giving permanent and semi-permanent employment to around 20,000 people. The poverty percentage in Pauri is around 29.36 per cent, which is highest in the state whereas, Tehri Garhwal has the lowest percentage of 10.15 per cent. DES Data provided by Pauri shows that the total area used under horticulture crops, in total, has reduced considerably in the year 2016-17 compared to the year 2015-16, due to which the fruits in the district production has also declined significantly.
Recommendations
Data shows that there has been a significant out migration from rural areas of the district. Out migration has taken place in 1025 out of a total of 1212 gram panchayats (2017-18). About 52 per cent of the migration has mainly taken place due to livelihood/employment opportunities. The main age group of migrants from the district is 26 to 35 years age. About 34 per cent of the migrants have gone outside the state, which is the second highest after Almora district. As per the survey conducted by the commission, 186 villages/toks have become depopulated after 2011, which accounts for about 25 per cent of the total depopulated villages/toks/majras in the state after 2011. There are 112 villages/toks/majras in the district whose population has declined by about 50 per cent after 2011 against a state figure of 565. The decadal growth of population (2001-2011) development blocks viz Thalisain, Khirsu and Kotdwara has shown an increase, though population in other development blocks has decreased or the increase has been very slow.
Report of Amit Singh Negi for idea for news from Dehradun.
